In a world where data drives decisions, Zence continues to lead the charge in helping businesses turn insights into action. With its latest release, Zence takes a big leap forward in providing deeper, more actionable analytics across the retail landscape. Whether you’re a CXO tracking growth, a category manager scanning trends, or a store head trying to drive local performance — this update has something for everyone.
Here’s a breakdown of what’s new and what it means for your business—along with some real-world scenarios.
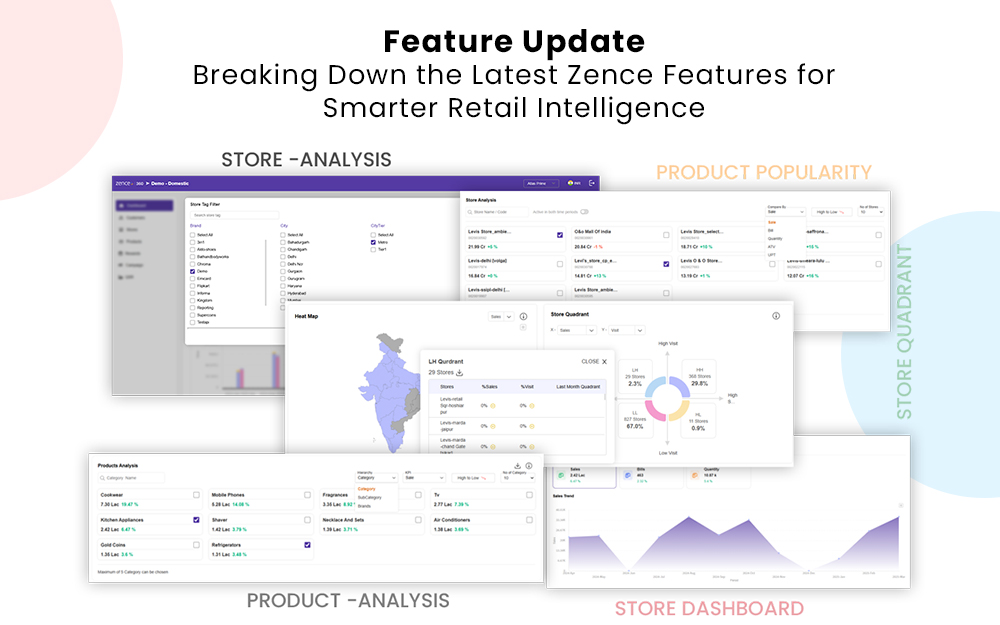
1. Smarter Dashboard. Deeper Insights.
The dashboard just got sharper, more intuitive, and laser-focused on what matters most, see your Total Sales split into Loyalty and Non-Loyalty. Same goes for Bills and Average Transaction Value (ATV)—all broken down to help you see the real impact of your loyalty program.
Example: Let’s say your team just launched a new loyalty campaign in Tier-1 cities. With the new split views, you can clearly track if loyalty sales are gaining momentum in Bengaluru versus say, Mumbai—and adapt campaigns accordingly.
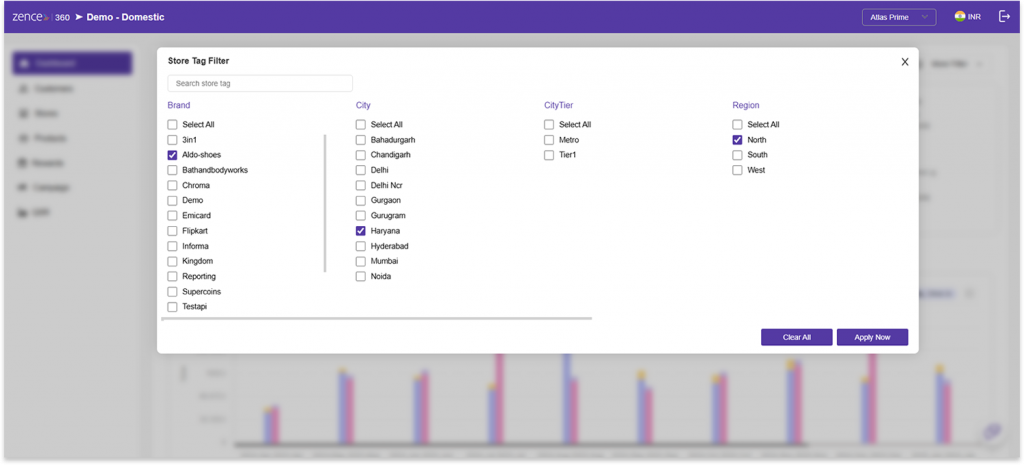
2. Multi-Tag Store Filters: Search Without Limits
Filtering data should feel like a breeze—and now it does. With the enhanced Store Tag Filter, you can now select multiple cities, regions, states, or custom tags all at once—cutting down on clicks and context-switching.
Example: Planning a festive promo just for North + East India? Select stores across Delhi, Kolkata, Lucknow, and Patna in one go—without toggling filters one by one.
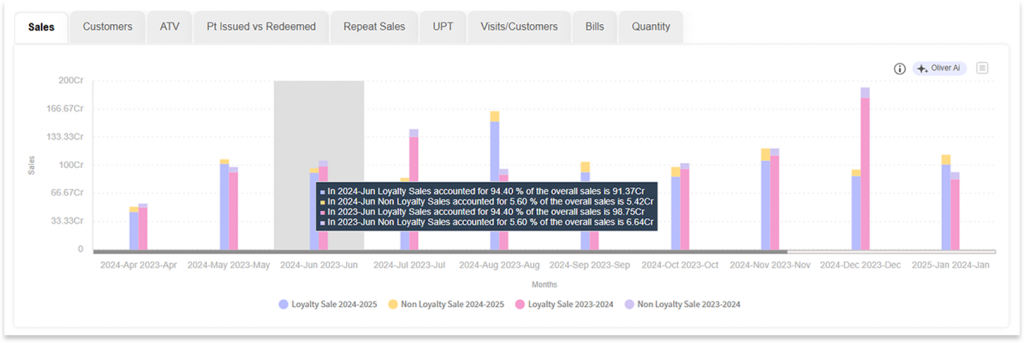
3. Loyalty vs Non-Loyalty Graphs: Make the Invisible Visible
Zence now visually displays the percentage of sales driven by loyalty vs non-loyalty—a clean, simple way to show value at a glance.
Example: Presenting to your CMO? These visuals make it easier to show how your loyalty strategy is scaling month over month, backed by hard numbers.
4. Store Quadrant Download: From Macro to Micro in a Click
With just one click, the Store Quadrant graph now lets you download lists of stores in each performance category—whether they’re stars or stragglers.
Example: Need to rally your low-performing stores for a Q2 push? Just click and download the list from the ‘Low Sales, Low Bills’ quadrant and start planning hyperlocal training or campaigns.
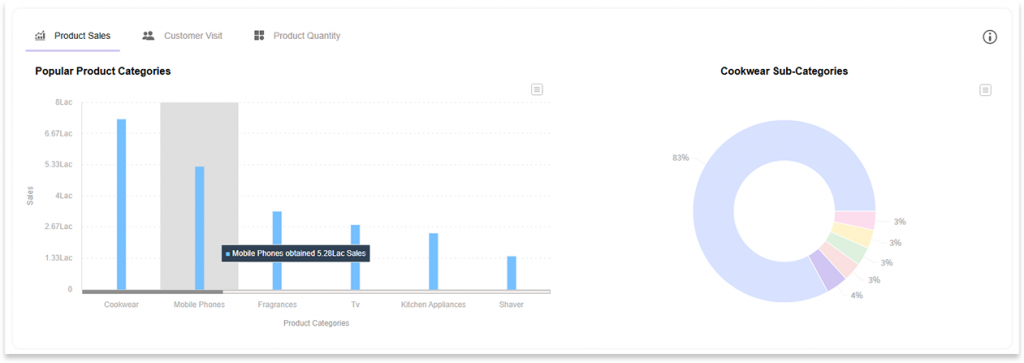
5. Product & Customer Trends: More Context, More Control
More context = smarter decisions. The Product Popularity graph now shows percentage share and value, and Customer Trend tooltips reveal detailed KPIs like count and growth trends.
Example: If you’re a category manager tracking combo meals, now you’ll know exactly what share of sales they drive—and if that’s growing or dipping.
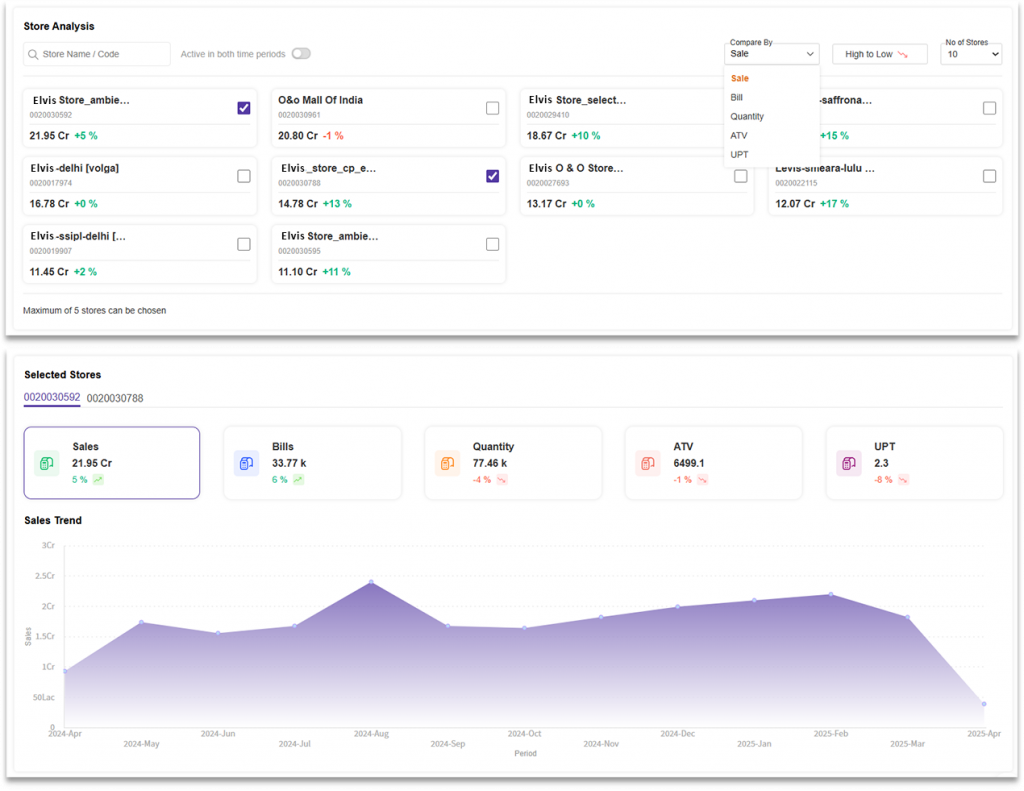
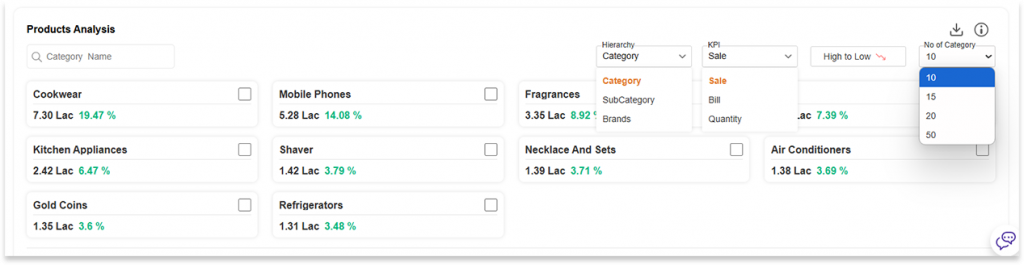
6. Store & Product Tables: Get Granular
Two new tables make it easier than ever to deep-dive:
- The Store Analysis Table lets you sort stores, view top/bottom performers (top 10, 15, 20, 50—you decide), and click into performance metrics.
- The Product Analysis Table gives category/subcategory penetration, along with KPIs like Sales, Bills, and Quantity.
Example: Suppose your beverages category seems underperforming—use the product table to drill into iced teas, smoothies, or cold brews and see where the drop is coming from.
Your Data Just Got Superpowers
This Zence update is about turning data into smart, timely action. Whether you’re optimizing store performance, tracking loyalty ROI, or understanding customer trends, these tools make it easier to answer the “why” behind every “what.”
The future of retail intelligence? It’s already here — with Zence leading the way.
Interested? Schedule a Demo